Abstract
Background: Digital tools that support open science practices play a key role in the seamless accumulation, archiving and dissemination of scholarly data, outcomes and conclusions. Despite their integration into open science practices, the providence and design of these digital tools are rarely explicitly scrutinized. This means that influential factors, such as the funding models of the parent organizations, their geographic location, and the dependency on digital infrastructures are rarely considered. Suggestions from literature and anecdotal evidence already draw attention to the impact of these factors, and raise the question of whether the open science ecosystem can realise the aspiration to become a truly “unlimited digital commons” in its current structure.
Methods: In an online research approach, we compiled and analysed the geolocation, terms and conditions as well as funding models of 242 digital tools increasingly being used by researchers in various disciplines.
Results: Our findings indicate that design decisions and restrictions are biased towards researchers in North American and European scholarly communities. In order to make the future open science ecosystem inclusive and operable for researchers in all world regions including Africa, Latin America, Asia and Oceania, those should be actively included in design decision processes.
Conclusions: Digital open science tools carry the promise of enabling collaboration across disciplines, world regions and language groups through responsive design. We therefore encourage long-term funding mechanisms and ethnically as well as culturally inclusive approaches serving local prerequisites and conditions to tool design and construction allowing a globally connected digital research infrastructure to evolve in a regionally balanced manner.
Digital tools for open science practices are readily available but often lack seamless interoperability. Key components of an open and effective digital scholarly ecosystem are persistent identifiers for researchers, research institutions, research items, and data points. Once we manage to align the existing infrastructure tools and services with each other through PIDs across all service providers, we will have a sustainable and reliable scholarly infrastructure that enables global research equity.
Dr Jo Havemann
Cite as
Bezuidenhout L and Havemann J. The varying openness of digital open science tools [version 2]. F1000Research 2021, 9:1292 (https://doi.org/10.12688/f1000research.26615.2)
DOST Visual Mapping
To view the map on the Kumu website go to kumu.io/access2perspectives/dost#dataset/
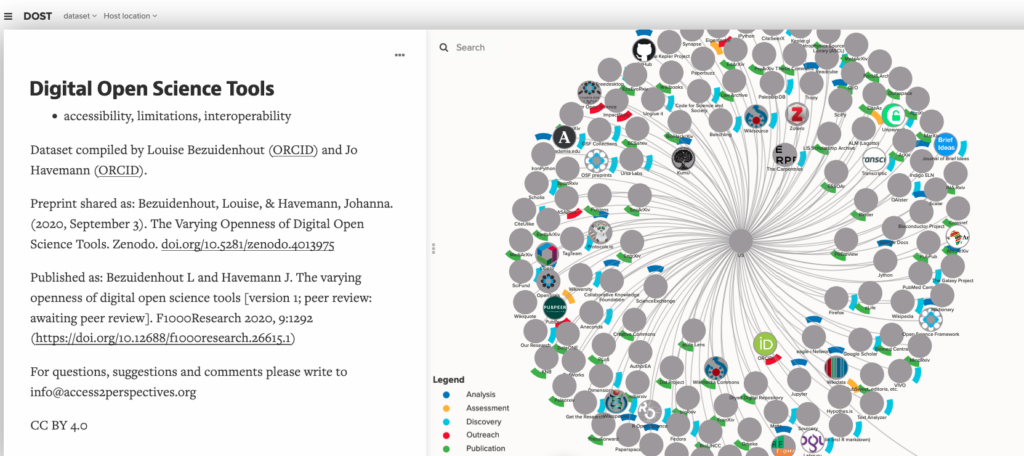
Underlying dataset: docs.google.com/spreadsheets/d/1vnA1oaO87WLxRpmqRmub3YLJcojQJkLmrOcv-Em2IAA/
email us or book a call to learn more and get involved.
Figures & tables from the manuscript


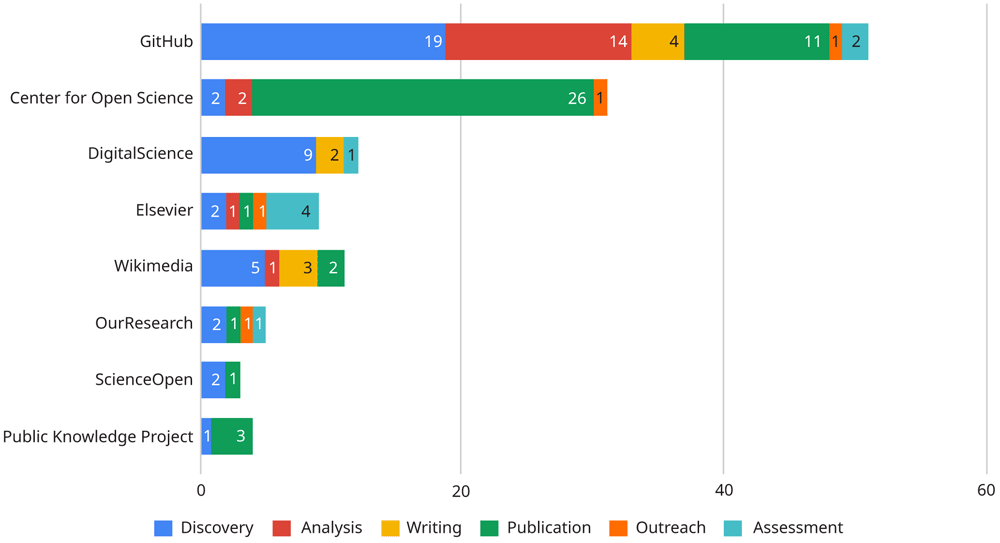
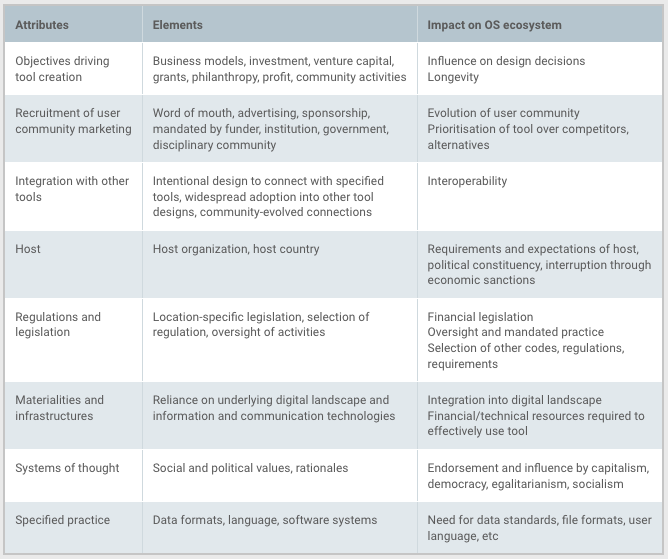
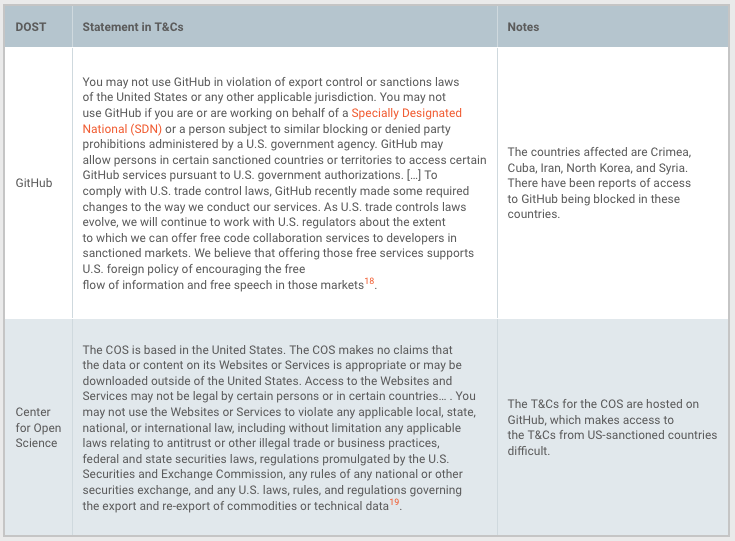
Table 2. Example T&Cs of two entities within the OS ecosystem.